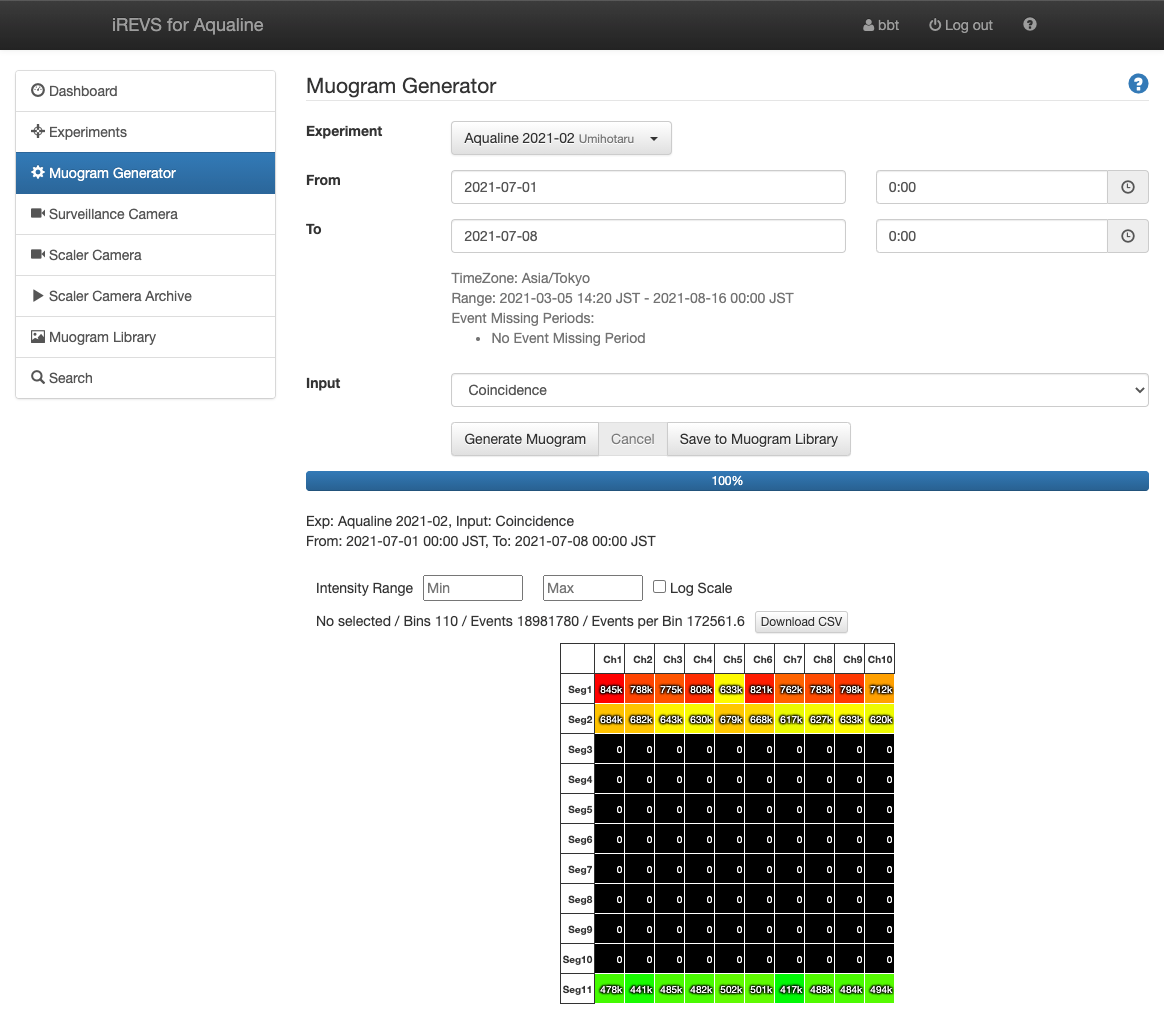
"Muogram Generator" can generates the Muogram by specifying the experiment, the period and the input for the detector.
You can save the generated Muogram in the Muogram Library and refer to it later and save it as the csv file.
If you don't belong to the experimental group, you cannot use the Muogram generator(Waring will be displayed).
How to generate Muogram and save it
- Select the experiment in "Experiment" pull-down menu.
- Select start and end time in "From", "To" pull-down menu.
- Select the input for the detector in "Input" pull-down menu.
- Click [Generate Muogram] button to generate the Muogram.
- Click [Save to Muogram Library] button to open dialog to save the generated Muogram in the Muogram Library.
- Enter Tittle and Summary
- Edit Description. The Description is displayed in Muogram detailed information.
- You can specify the publish conditions of generated Muograms at Visible Group and the editable user group of generated Muograms at Editable Group. For details, Refer to Permission.
- If you save the generated Muogram, push [Save] button. If you cancel generating Muogram, push [Cancel] button.
Click [Cancel] button to stop generating Muogram(cannot resume).
*The Muogram is generated in the browser. Closing the browser before saving the Muogram in the Muogram library will cause the result to disappear.
Range of experiment and Event Missing Periods are displayed below "To" field.
With the Intensity Range, you can edit the Min / Max field to change the colormap of minimum and maximum value.
By checking Log Scale check box, you can display a colormap in log scale. Or in linear scale.
By pushing Download CSV button, you can download the graph value as a csv file.
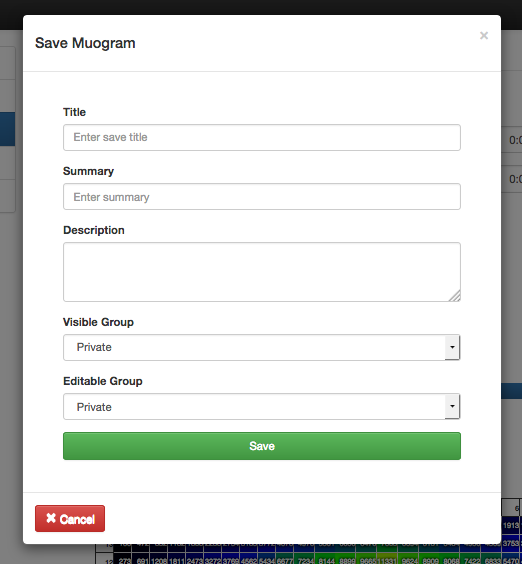
Title and Summary are displayed with thumbnail in the Muogram Library.
Title is a necessary item for saving Muogram.
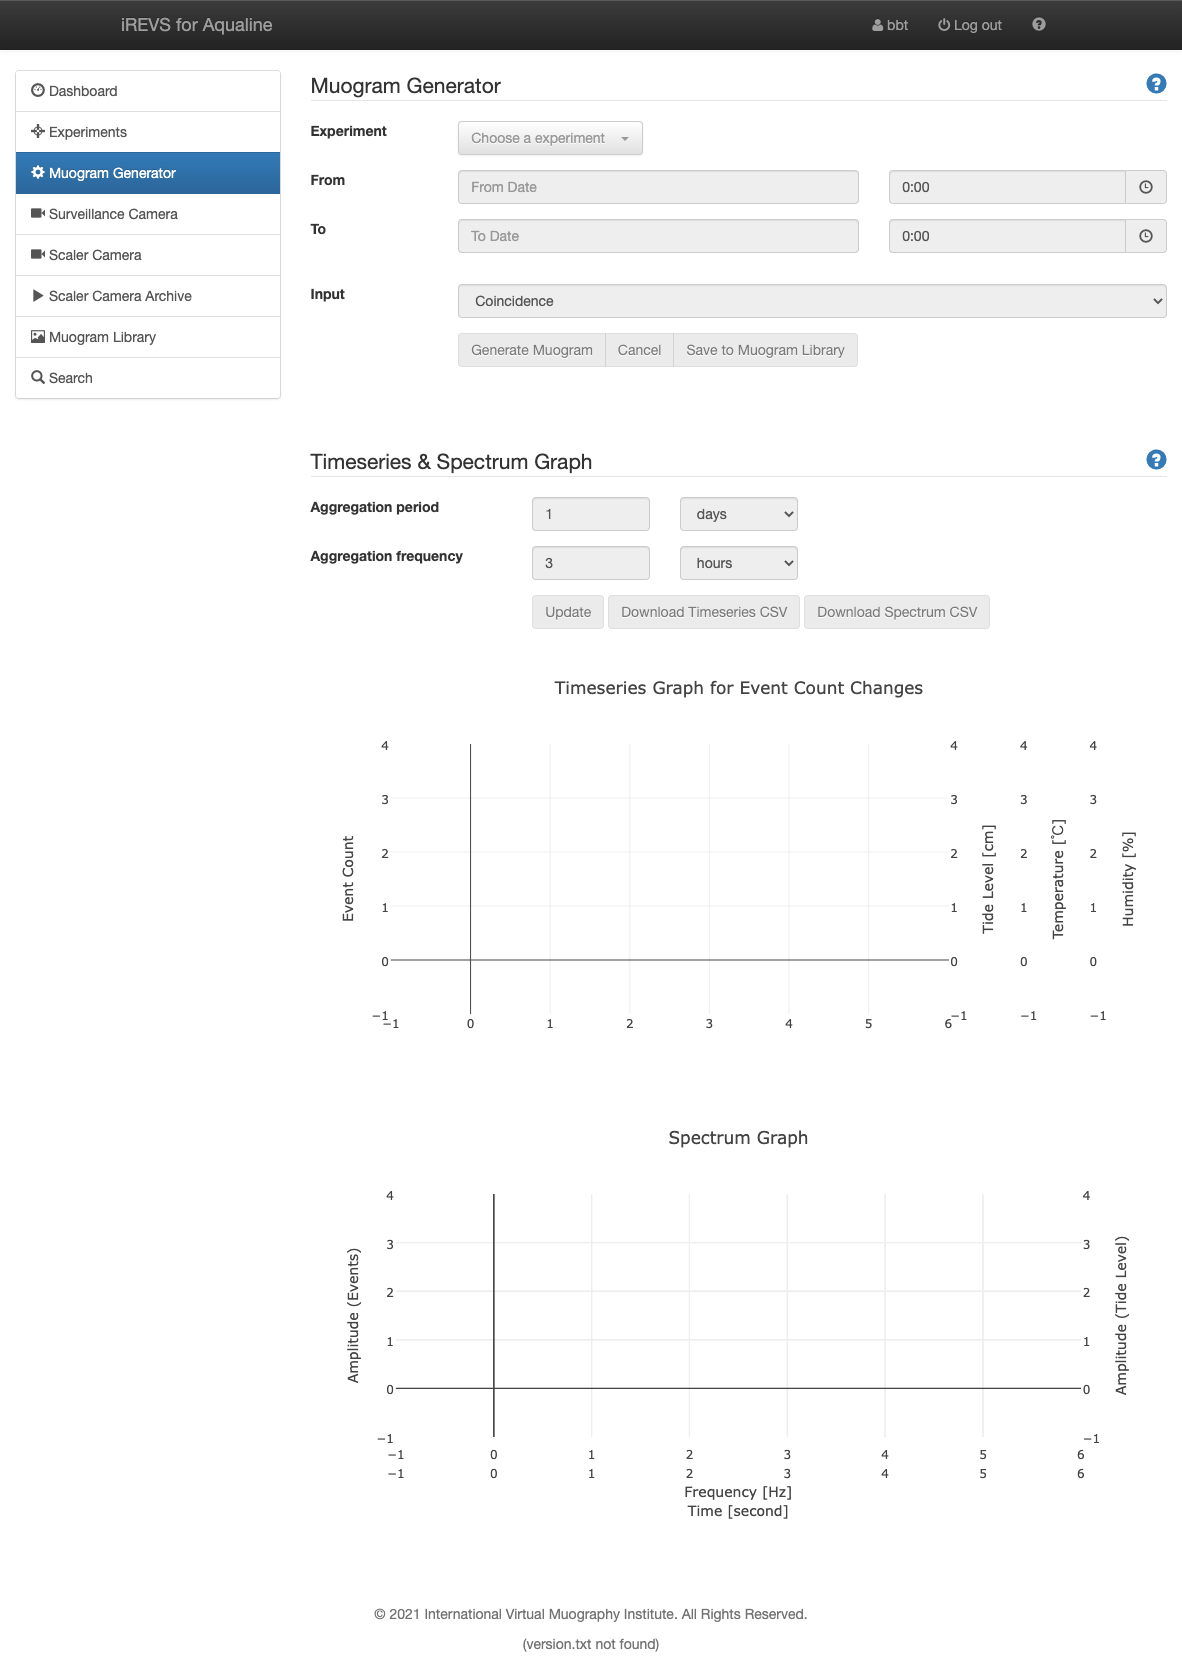
Timeseries Graph and Spectrum Graph can be created for the specified bin range (region of interest) of the Muogram created by Muogram Generator.
The Timeseries Graph contains the following information.
- Time series change in the number of events created from the specified aggregation period and aggregation frequency.
- Time series of observed and predicted tide levels in Chiba and Yokosuka, Japan.
- The tide level in Chiba is the height from 120 cm below the mean tide level.
- The tide level in Yokosuka is the height from 110 cm below the mean tide level.
- Time series of temperature and humidity near the detectors.
The Spectrum Graph displays the results of a spectrum analysis (FFT) of the time series change in the number of events, and of the time series of the tide level (observed and predicted) in Chiba and Yokosuka. The FFT analysis would be done after offsetting the average value to be zero to remove the DC component.
In each graph, you can switch between showing and hiding the data series by clicking on the legend in the upper right corner.

To specify the bin range, drag Muogram.
To cancel specifying the bin range, click Muogram at any position.
When you specify the bin range, bin information is displayed above Muogram.
From the left, the bin information shows the coordinates of the selection range, the number of bins, the total number of events in the bin range, and the average number of events (per bin).
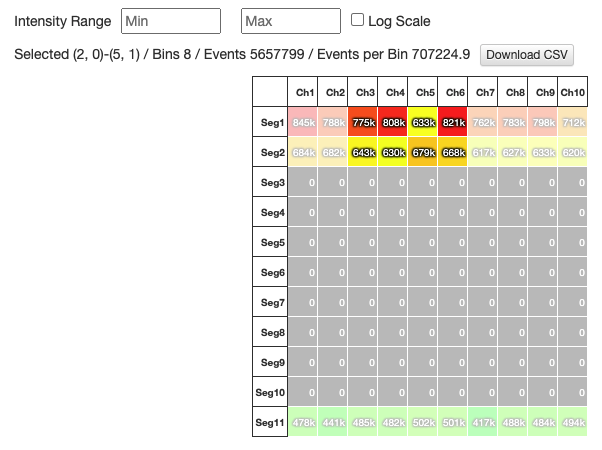
If you don't specify the bin range, the Timeseries Graph and the Spectrum Graph of the entire Muogram is displayed.
Click Update button after selecting Aggregation period and Aggregation frequency.
Each setting item, buttons are as follows.
- Aggregation period :
- Aggregation frequency :
- Update button : Display and update the graph.
- Download Timeseries CSV button : Download the CSV file of Timeseries Graph.
- Download Spectrum CSVbutton : Download the CSV file of Spectrum Graph.
You can set the time period for totaling the number of events per Timeseries Graph plot.
For example, if you set "Aggregation period" to 1 days, the total number of events is 24 hours.
Set the number in the text box and select days/hours/minutes from the pull-down menu.
You can set how often the plots in the Timeseries Graph should be placed.
For example, when you set "Aggregation frequency" to 3hours, the gap of plot is 3 hours.
Input the number in the text box and select days/hours/minutes from the pull-down menu.
In the Timeseries Graph, the blue plot represents the number of events that set at "Aggregation period", "Aggregation frequency". The vertical error bar represents the square root of number of events, the horizontal error var represents the aggregation period. When you hover the mouse cursor on the plot, you can view the number of events, the range of error of number of events, tide level, temperature, humidity, date and time and the total period of events(±time).
The bin width of the Spectrum Graph depends on the length of the Muogram creation period. The number of bins depends on the number of bins of the time series data to be analyzed.